Configuration
/etc/supervisord.conf
This configuration file is based on the template seduce.conf.example
[frontend]
listen = 0.0.0.0
port = 8081
public_address = 127.0.0.1

[api]
listen = 0.0.0.0
port = 5000
public_address = 127.0.0.1

[mail]
smtp_address = smtp.gmail.com
smtp_port = 587
account = EMAIL_ACCOUNT
password = EMAIL_PASSWORD

[admin]
user = admin
password = ADMIN_PASSWORD

[influx]
address = 127.0.0.1
port = 8086

[redis]
address = 127.0.0.1
port = 6379

[bot]
token = TELEGRAM_API_KEY

[db]
connection_url = jdbc:sqlite:/Users/jonathan/Documents/workspace/ds18b20/test.db
Fill the previous template file and store it in one of the following path:
/etc/seduce.conf~/seduce.confconf/seduce/seduce.conf
conf/sensors.yaml
This file contains all:
- classes of sensors
- sensors trees
- sensors
classes of sensor are defined as follow:
classes:

  wattmeter: &wattmeter
    sensor_type: wattmeter
    unit: W

  watt_cooler_b232: &watt_cooler_b232
    <<: *wattmeter
    method: flukso
    ip: 192.168.1.48
    port: 8080
    location: B232
    parent: watt_cooler_b232
in the previous snippet, we define two classes of sensors : the first one is wattmeter which
define general properties for sensors classes, and a second class watt_cooler_b232 which inherits
wattmeter and defines properties of sensors related to cooler in b232 room.
and a sensor is defined as follow:
flukso:
  watt_cooler_b232_1:
    info: Flukso B232 (clamp1)
    name: watt_cooler_b232_1
    sensor_id: c6a2caade50d7532ee3a3292238fd587
    <<: *watt_cooler_b232
in the previous snippet, we define a sensor tree flukso,
which contains a single sensor watt_cooler_b232_1
conf/racks.yaml
This file describe the racks monitored by the SeDuCe infrastructure. It contains data defined as follow:
name: ecotype
racks:
  Z1.1:
    ecotype-37:
      position: 32
      type: compute
    ecotype-38:
      position: 30
      type: compute
site: nantes.grid5000.fr
in the previous snippet, we define that the racks belong to a cluster named ecotype,
located in domain name nantes.grid5000.fr and which contains at least one rack named Z1.1
that have 2 elements ecotype-37 and ecotype-38.
For each element, we define its position in the racks (1 in in the bottom and 42 is in the top), and the type of the element.
The type of an element can be compute for computer servers, or switch for network switches.
conf/room_map.yaml
This configuration file is used to generate the following image:
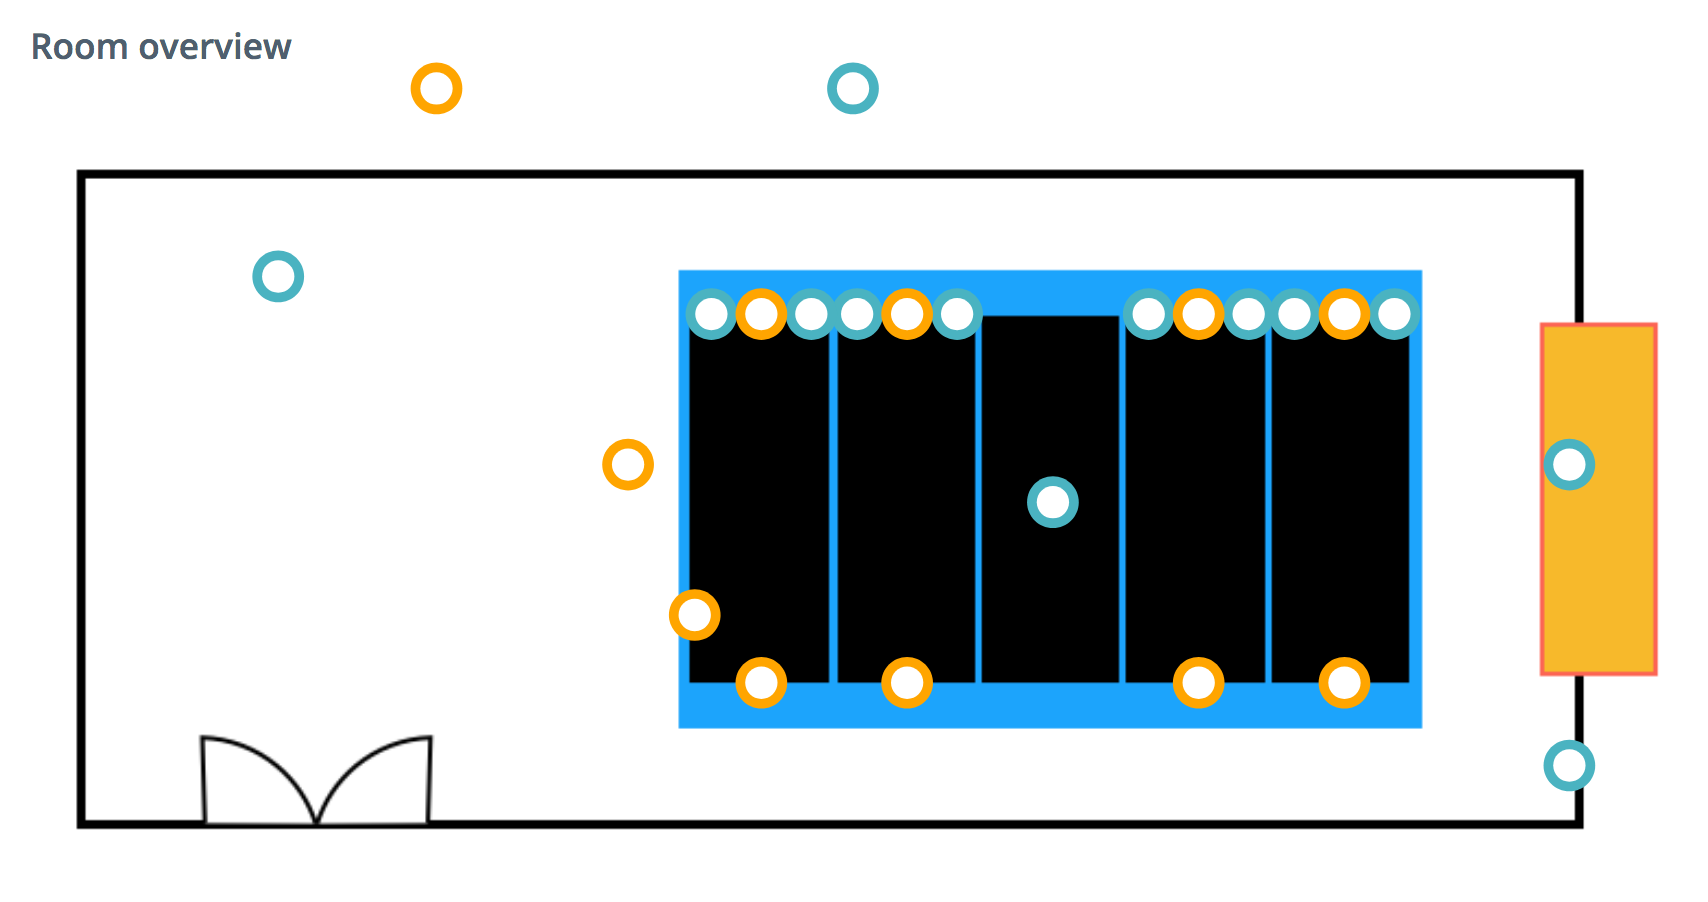
Each colored circle of the map is defined as follow:
pdu-Z1.10:
  coordinates:
    x: 82.5%
    y: 25%
  info: PDU (pdu-Z1.10) of rack z1.10
  location: B232
  name: pdu-Z1.10
  color: blue
  sensors:
  - ecotype-37_pdu-Z1.10
  - ecotype-38_pdu-Z1.10
  - ecotype-39_pdu-Z1.10
  - ecotype-40_pdu-Z1.10
  - ecotype-41_pdu-Z1.10
  - ecotype-42_pdu-Z1.10
  - ecotype-43_pdu-Z1.10
  - ecotype-44_pdu-Z1.10
  - ecotype-45_pdu-Z1.10
  - ecotype-46_pdu-Z1.10
  - ecotype-47_pdu-Z1.10
  - ecotype-48_pdu-Z1.10
In the previous snippet, we defined a sensor tree called pdu-Z1.10, which is located at the coordinate (82.5%, 25%)
relatively to the top left corner of the map. The color of the circle is defined with the color property.
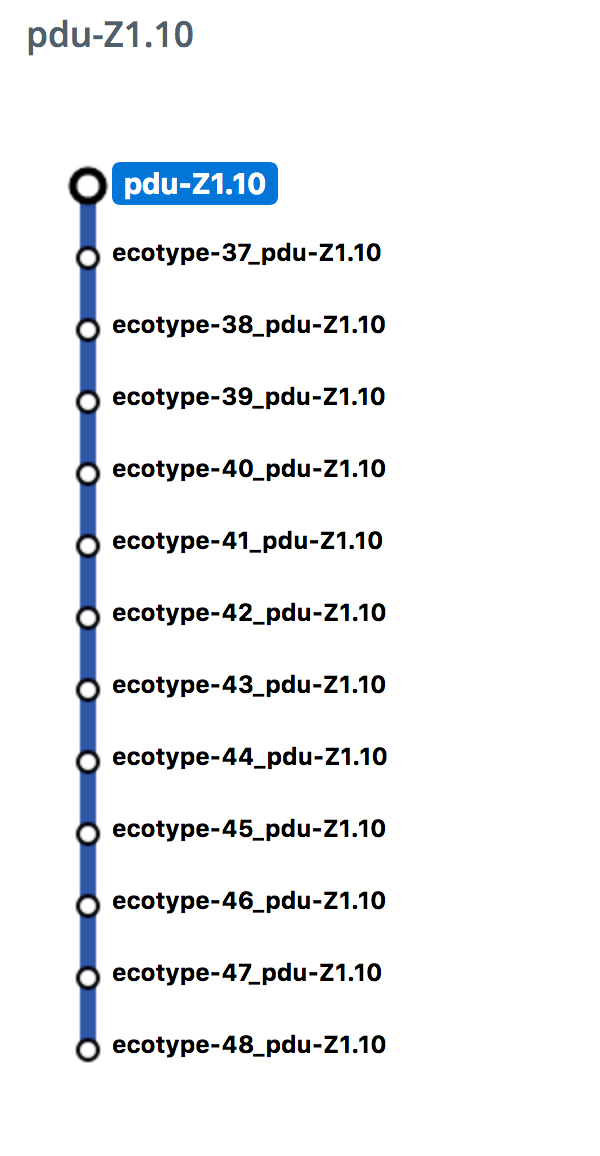
With the sensors property we define the list of sensors associated to the sensor tree. This list corresponds to the list
that appears on the right of the map when the colored circles is clicked:
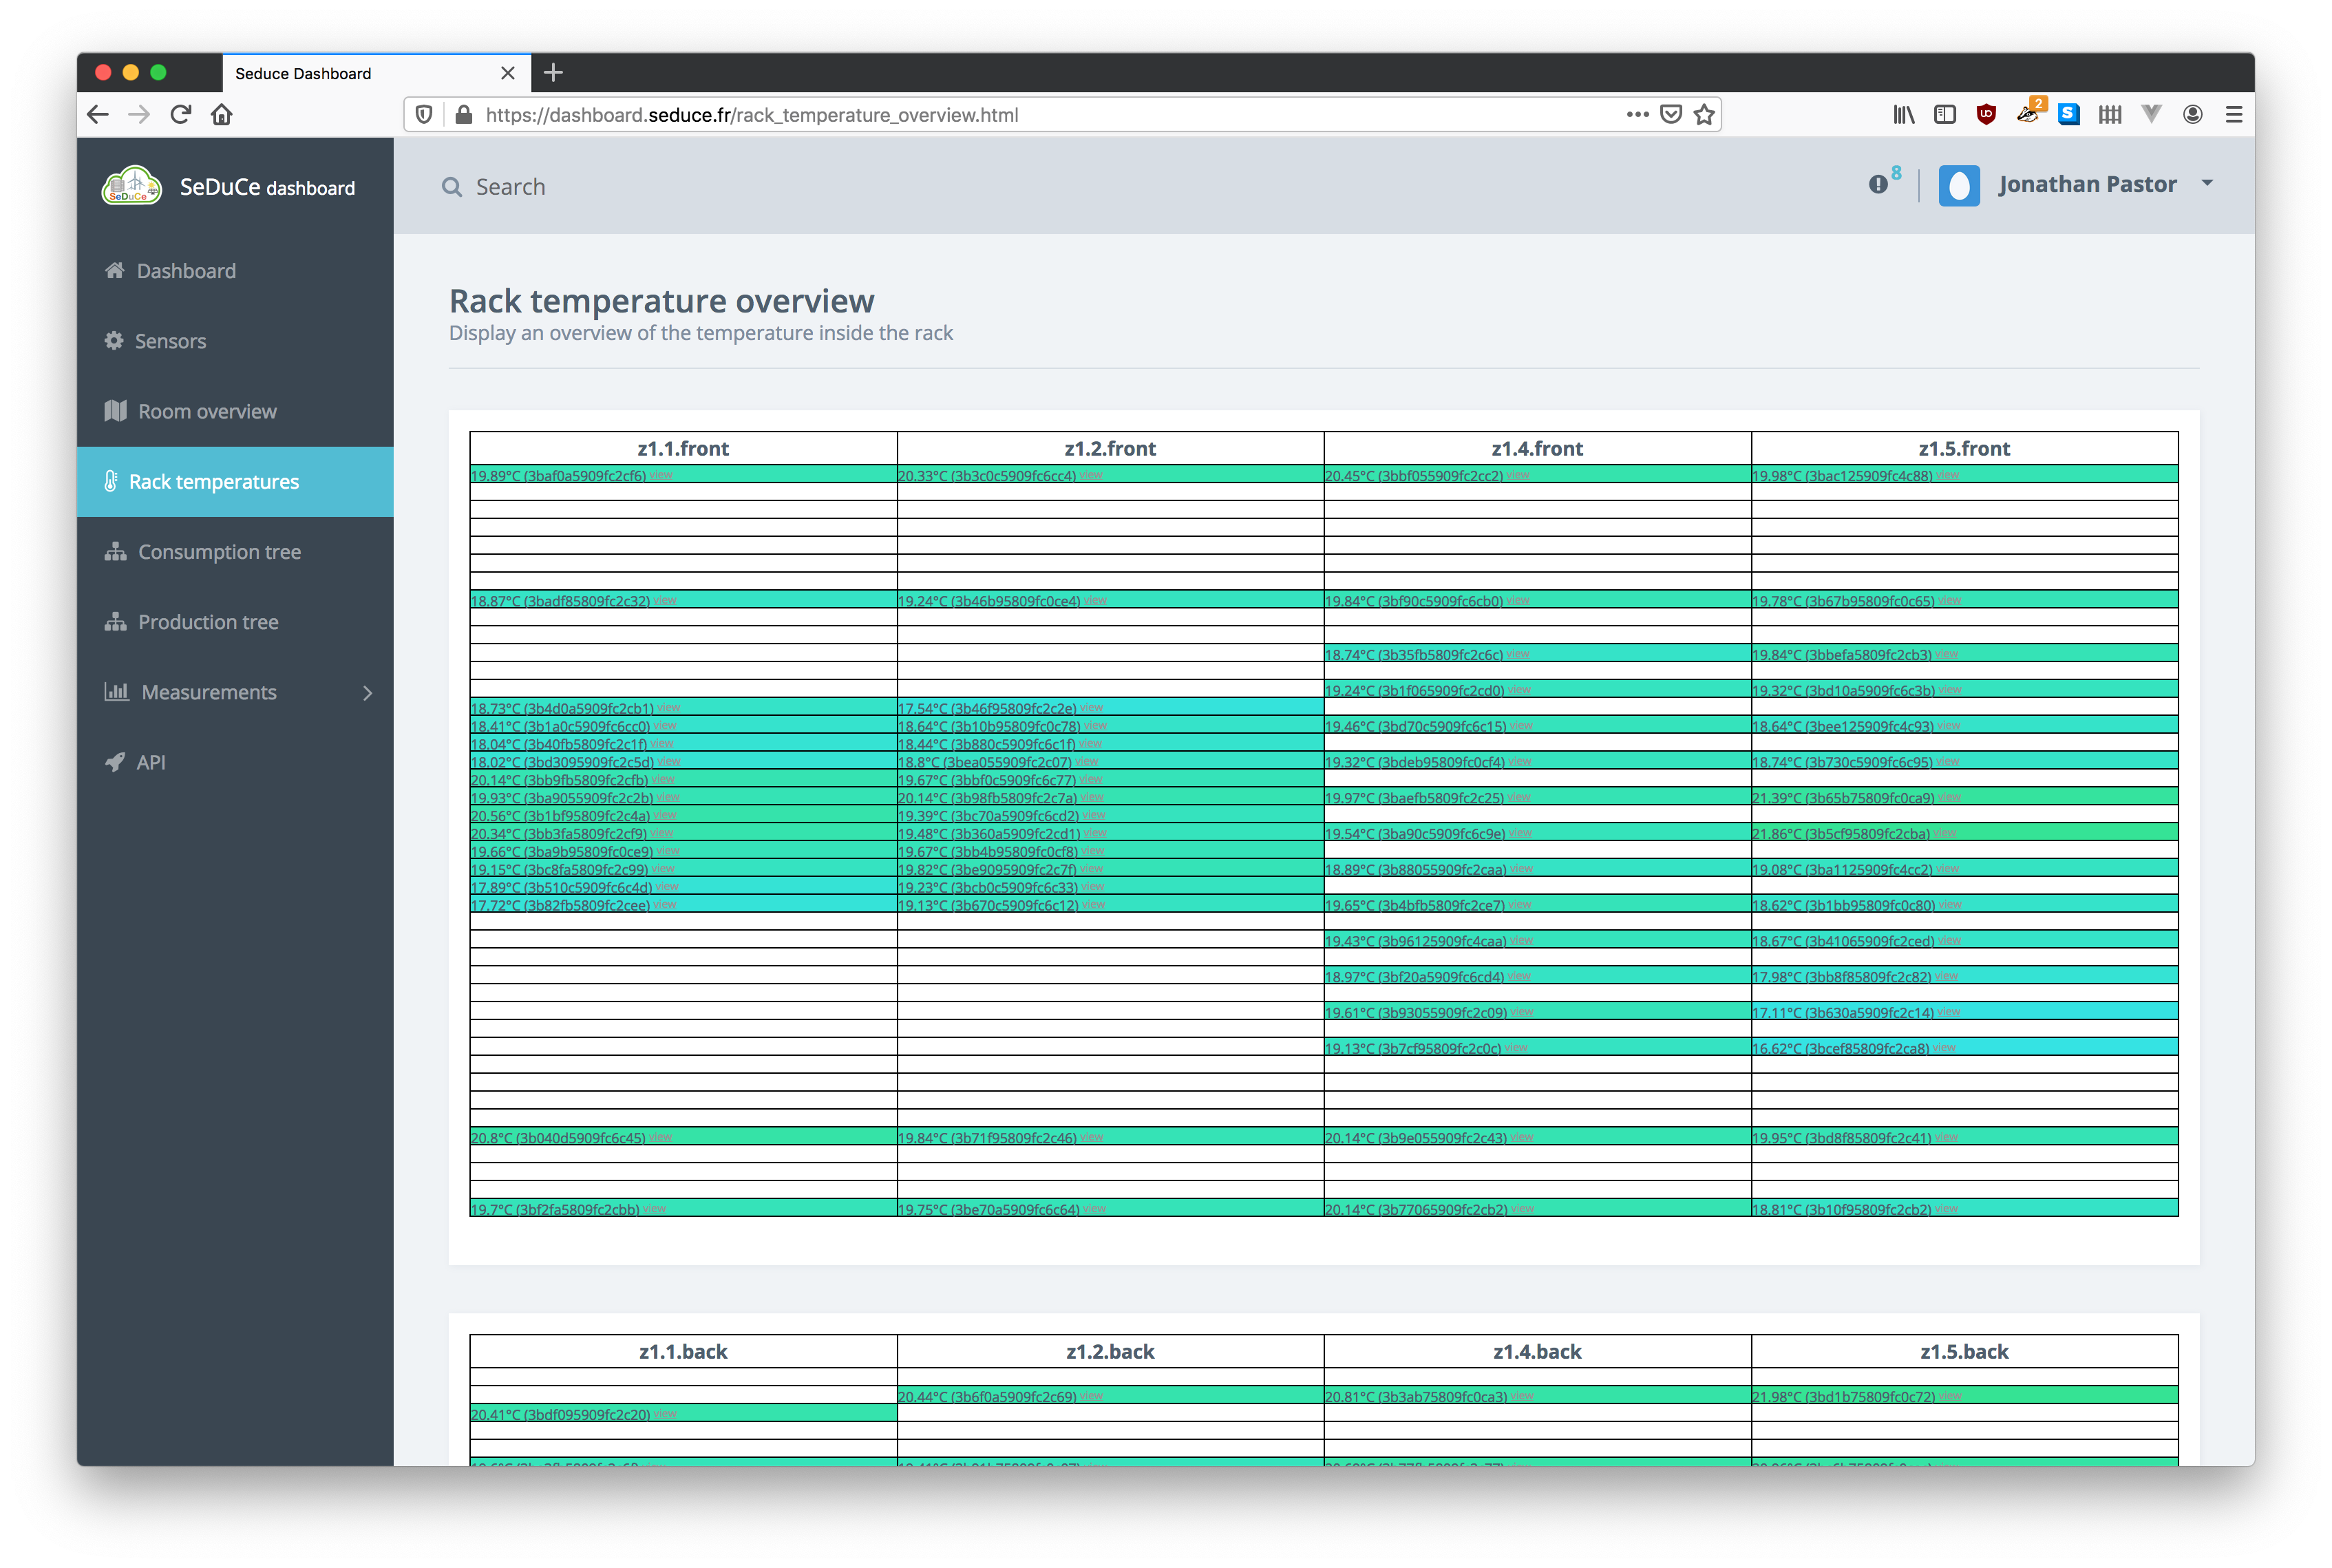
conf/temperature.yaml
In this configuration file we define the layout of temperature sensors of the SeDuCe infrastructure. The data follows this format:
room:
  top:
    '1':
      serie: 28b8fb2909000003
      tags:
      - external-temperature
In the previous snippet we defined an overall position room, which can contains several sides. In this case we define
a side top as the temperature sensor of the server room is located in the top. For temperature sensors in racks, we
generally encounter two sides front and back which respectively correspond to the cold aisle and the hot aisle of
racks.
In the previous snippet '1' corresponds to the position in racks (please note that it is defined as a string because the yaml files are the result of a previous migration process, it could be moved to a int type with few modifications to the implementation of the dashboard),
we associate this position with a sensor defined in conf/sensors.yaml and can provide optional tags to the sensor.
This file is used to generate this visualisation:
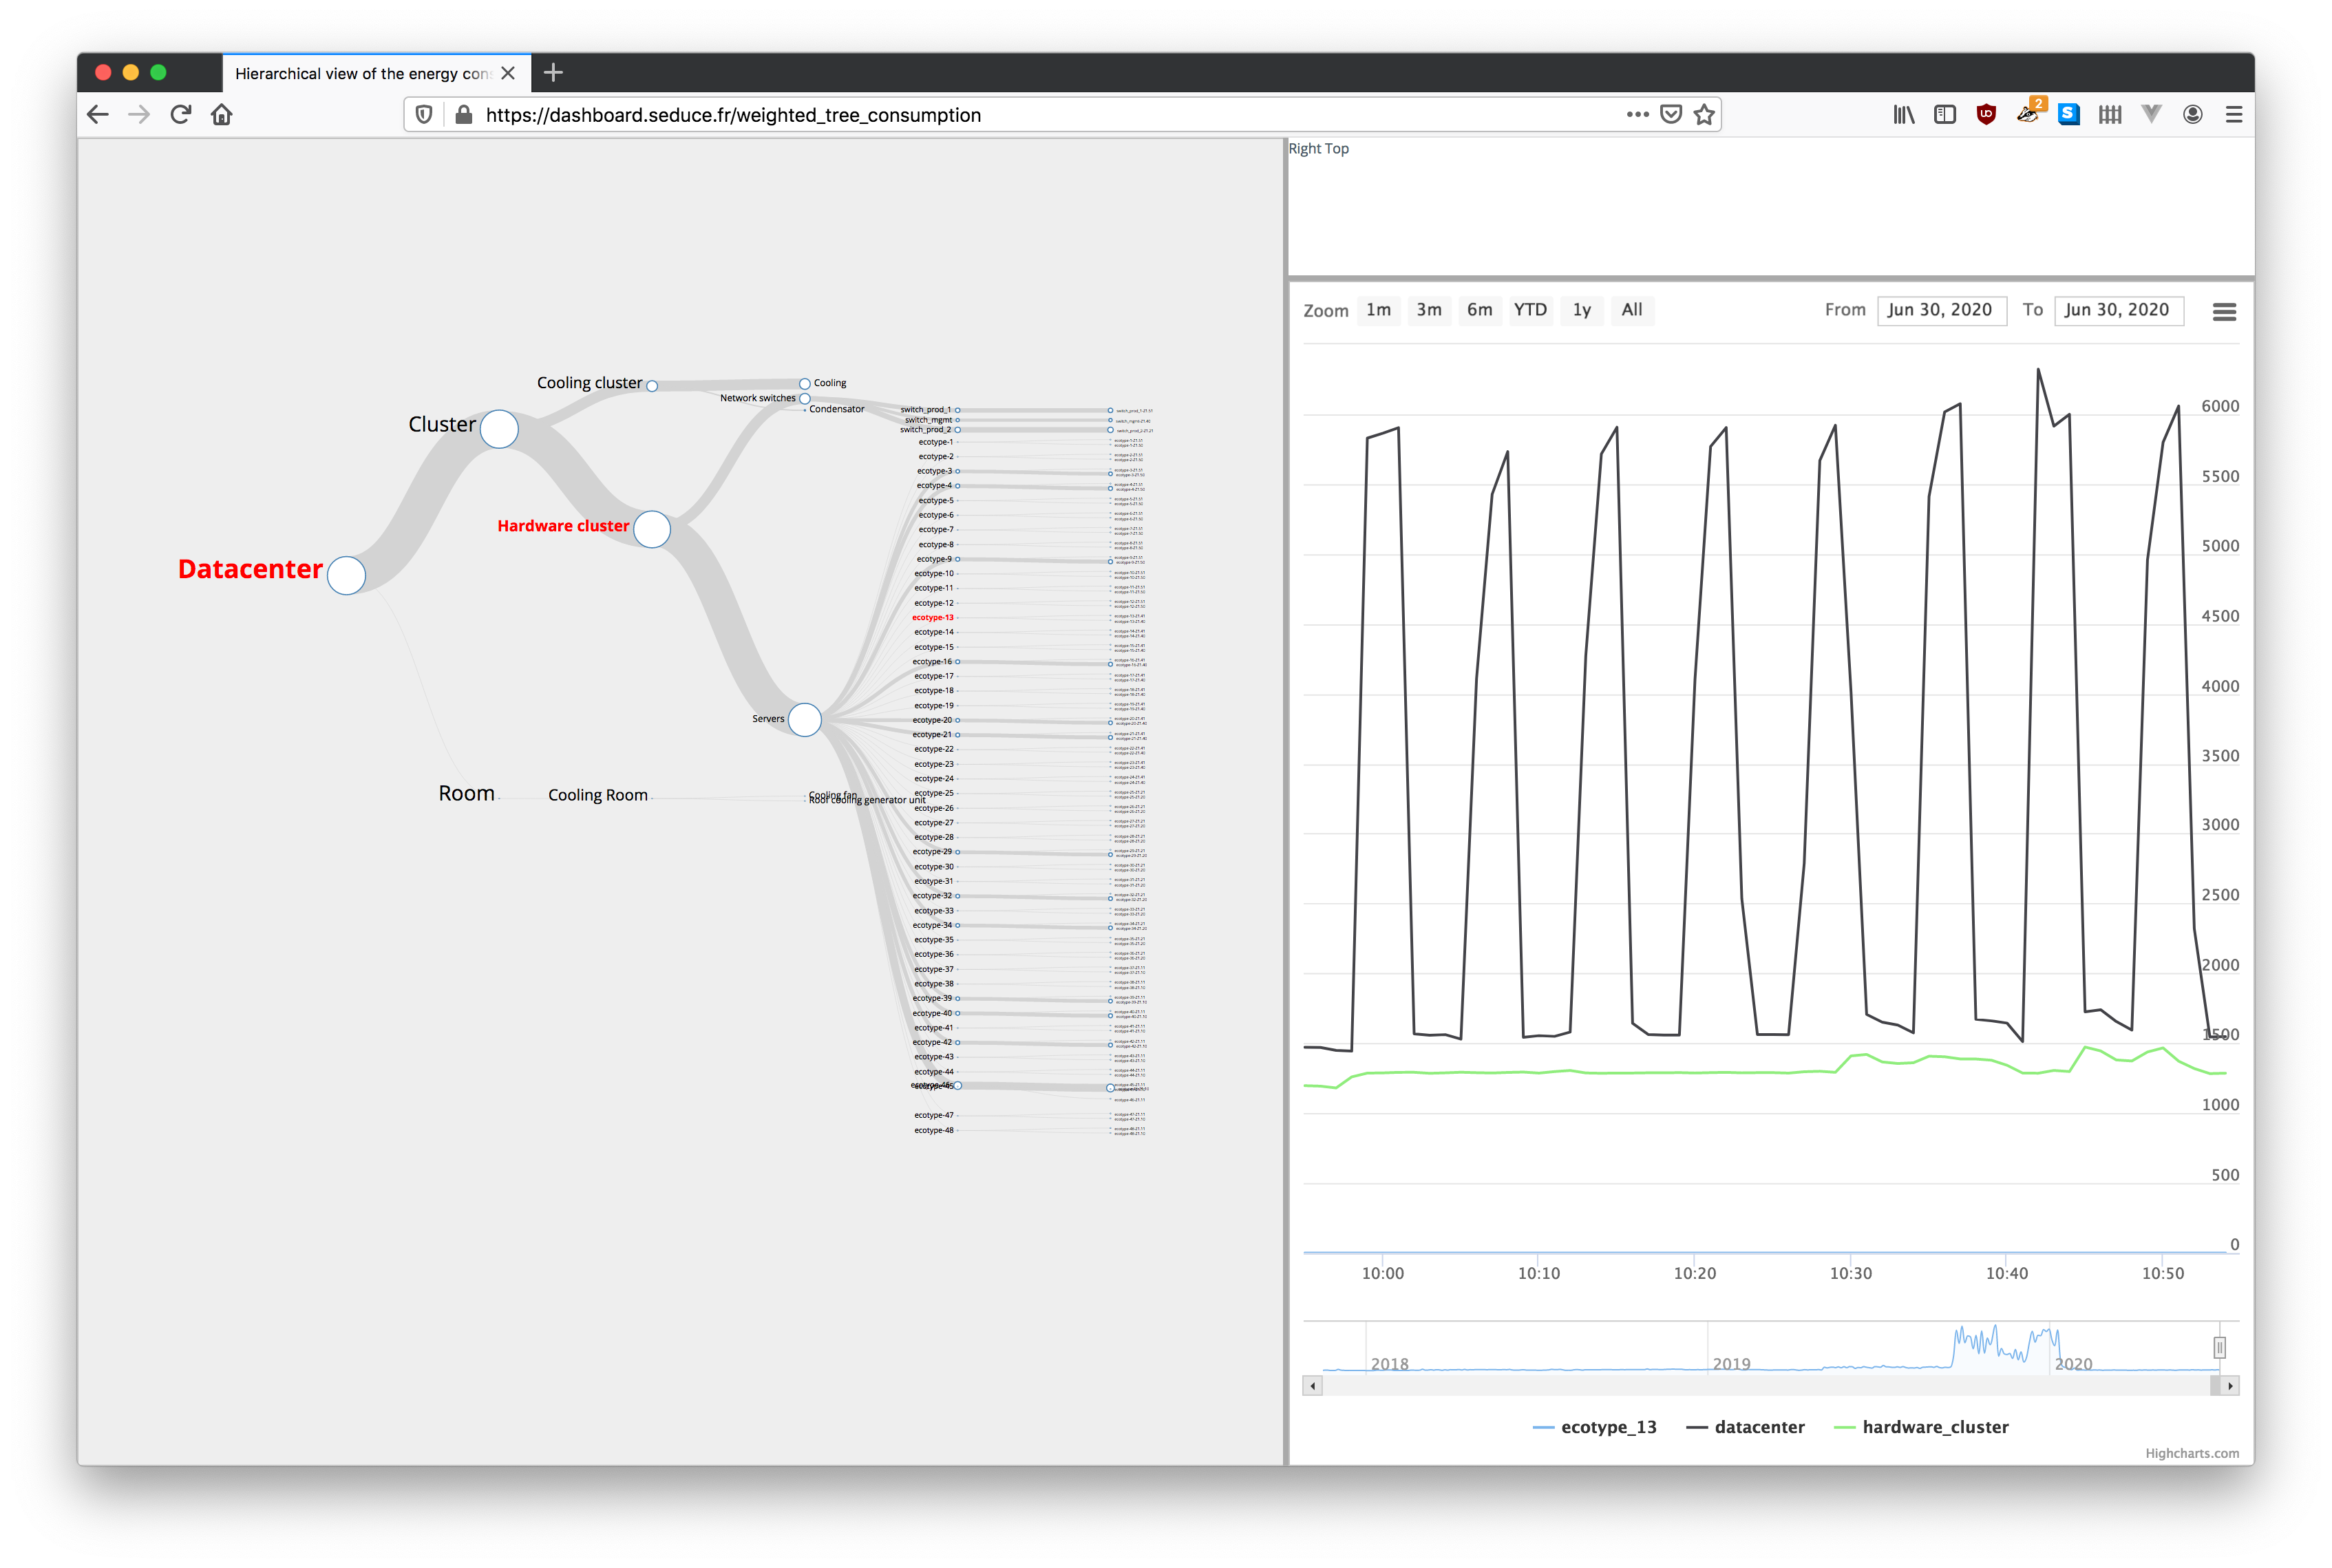
conf/multitree.yaml
This file define how the power consumptions measured by wattmeters can be aggregated to understand their contribution to the overall power consumption of the server room. Its data follows the following format:
datacenter:
  children:
  - servers
  - cooling
  id: datacenter
  name: Datacenter
  root: true

servers:
  children:
  - ecotype1
  - ecotype2
  id: servers
  name: Servers

ecotype_1:
  children:
  - ecotype_1_Z1_51
  - ecotype_1_Z1_50
  id: ecotype_1
  name: ecotype-1
ecotype_1_Z1_50:
  id: ecotype_1_Z1_50
  name: ecotype-1-Z1.50
  target: ecotype-1_pdu-Z1.50
ecotype_1_Z1_51:
  id: ecotype_1_Z1_51
  name: ecotype-1-Z1.51
  target: ecotype-1_pdu-Z1.51

ecotype_2:
  children:
  - ecotype_2_Z1_51
  - ecotype_2_Z1_50
  id: ecotype_2
  name: ecotype-2
ecotype_2_Z1_50:
  id: ecotype_2_Z1_50
  name: ecotype-2-Z1.50
  target: ecotype-2_pdu-Z1.50
ecotype_2_Z1_51:
  id: ecotype_2_Z1_51
  name: ecotype-2-Z1.51
  target: ecotype-2_pdu-Z1.51
In the previous snippet we define a simplified view of the datacenter : it contains
two servers ecotype_1 and ecotype_2 which each have two metered electrical plugs
ecotype_1_Z1_51, ecotype_1_Z1_50, ecotype_2_Z1_51, ecotype_2_Z1_50. The consumption
of each servers aggregates the consumption to each of its plugs, and the consumption of the
the servers are aggregated in the servers node, and the datacenter node aggregates
the consumption of the servers node and the cooling node (which is not explicetely
defined for the sake of the example).
Each node definition follows this format:
- a yaml key (
datacenter,servers, ...) defines a node block - an
idproperty which is used to reference the block in other blocks - a
nameproperty defines the label that will be displayed on visualisation - if the node is not a leaf, a
childrenproperty defines the ids of the children nodes - if the node is a leaf, a
targetproperty defines the sensor corresponding to the node
A node definition results in the creation of several influxdb continuous queries, each node having its own set of continuous queries:
cq_datacenter_30s:
CREATE CONTINUOUS QUERY cq_datacenter_30s ON pidiou BEGIN SELECT sum(mean) AS value INTO pidiou.autogen.cq_datacenter_30s FROM (SELECT mean(value) FROM pidiou.autogen.sensors WHERE (sensor = 'cooling' OR sensor = 'ecotype-1_pdu-Z1.51' OR sensor = 'ecotype-1_pdu-Z1.50' OR sensor = 'ecotype-2_pdu-Z1.50' OR sensor = 'ecotype-2_pdu-Z1.51') GROUP BY time(30s), sensor) GROUP BY time(30s) END
cq_datacenter_1m:
CREATE CONTINUOUS QUERY cq_datacenter_1m ON pidiou BEGIN SELECT sum(value), mean(value), stddev(value), count(value), median(value), min(value), max(value) INTO pidiou.autogen.cq_datacenter_1m FROM pidiou.autogen.cq_datacenter_30s GROUP BY time(1m), sensor_type END
cq_datacenter_1m:
CREATE CONTINUOUS QUERY cq_datacenter_1m ON pidiou BEGIN SELECT sum(value), mean(value), stddev(value), count(value), median(value), min(value), max(value) INTO pidiou.autogen.cq_datacenter_1m FROM pidiou.autogen.cq_datacenter_30s GROUP BY time(1m), sensor_type END
cq_datacenter_1h:
CREATE CONTINUOUS QUERY cq_datacenter_1h ON pidiou BEGIN SELECT sum(value), mean(value), stddev(value), count(value), median(value), min(value), max(value) INTO pidiou.autogen.cq_datacenter_1h FROM pidiou.autogen.cq_datacenter_30s GROUP BY time(1h), sensor_type END
cq_datacenter_1d:
CREATE CONTINUOUS QUERY cq_datacenter_1d ON pidiou BEGIN SELECT sum(value), mean(value), stddev(value), count(value), median(value), min(value), max(value) INTO pidiou.autogen.cq_datacenter_1d FROM pidiou.autogen.cq_datacenter_30s GROUP BY time(1d), sensor_type END
We can notice that the _30s queries use all sensors of subnodes.
This file is used to generate this visualisation:
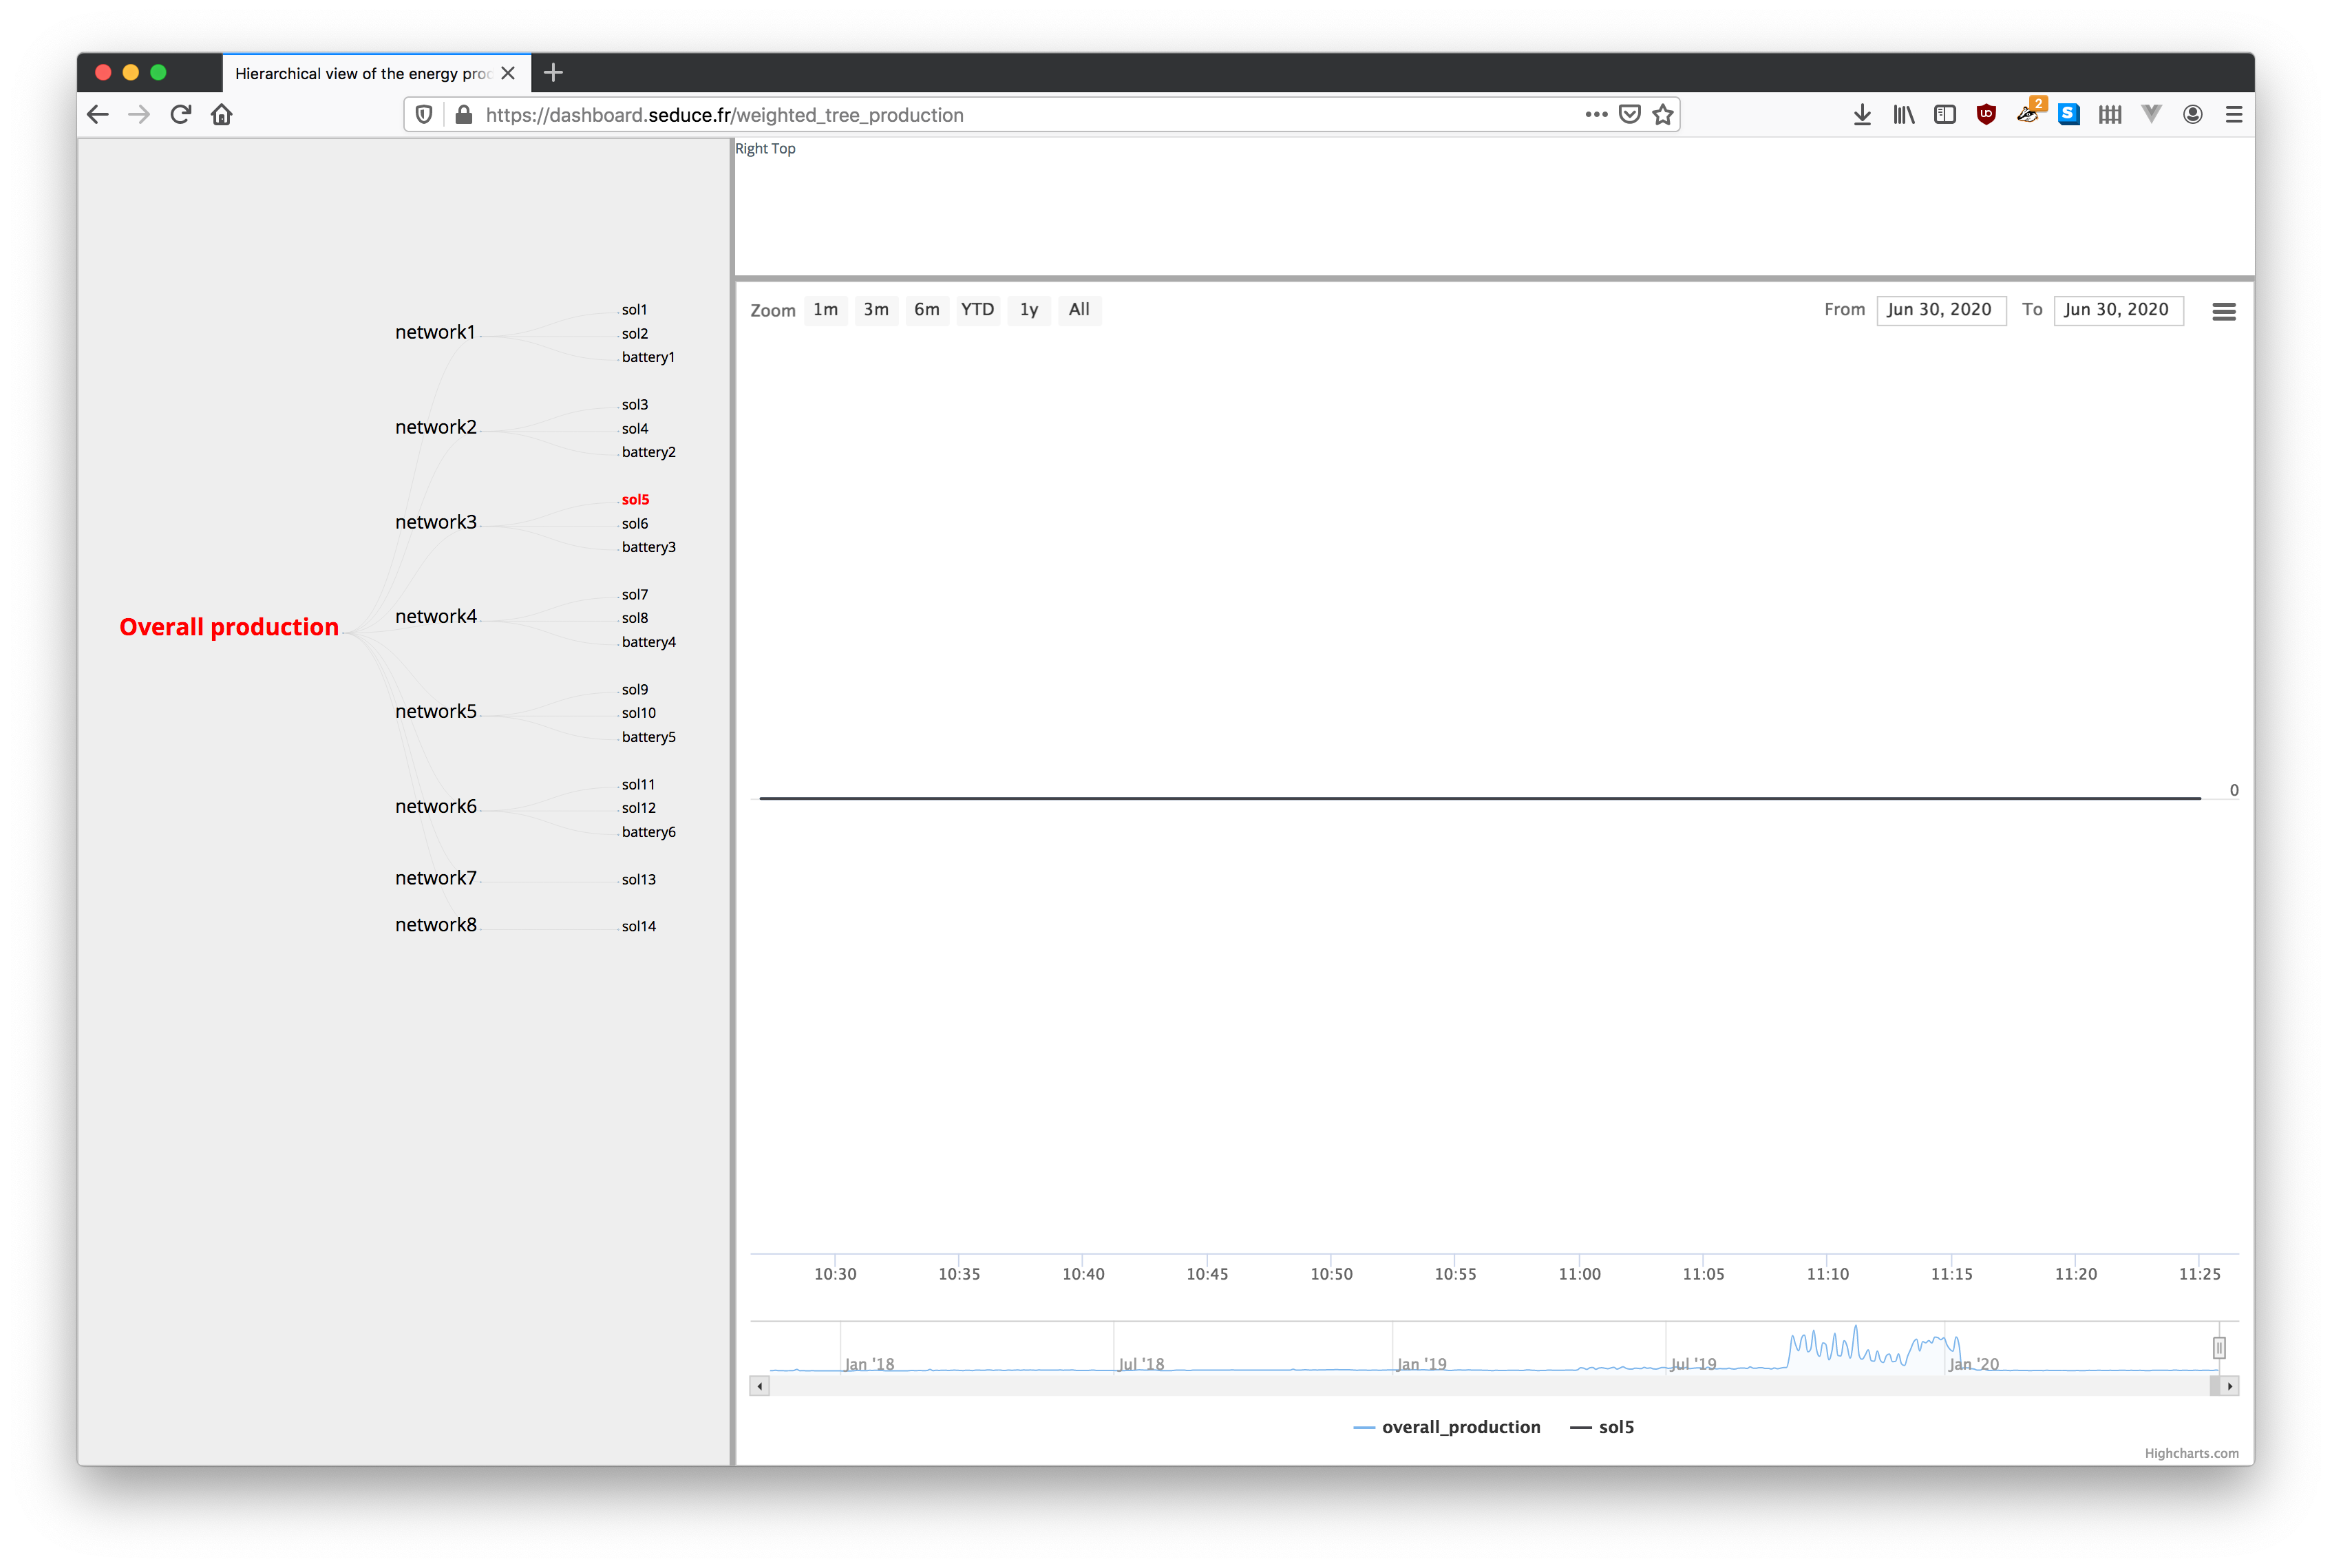
conf/production.yaml
The functionning of this file is similar to conf/multitree.yaml.
It is used to generate this visualisation:
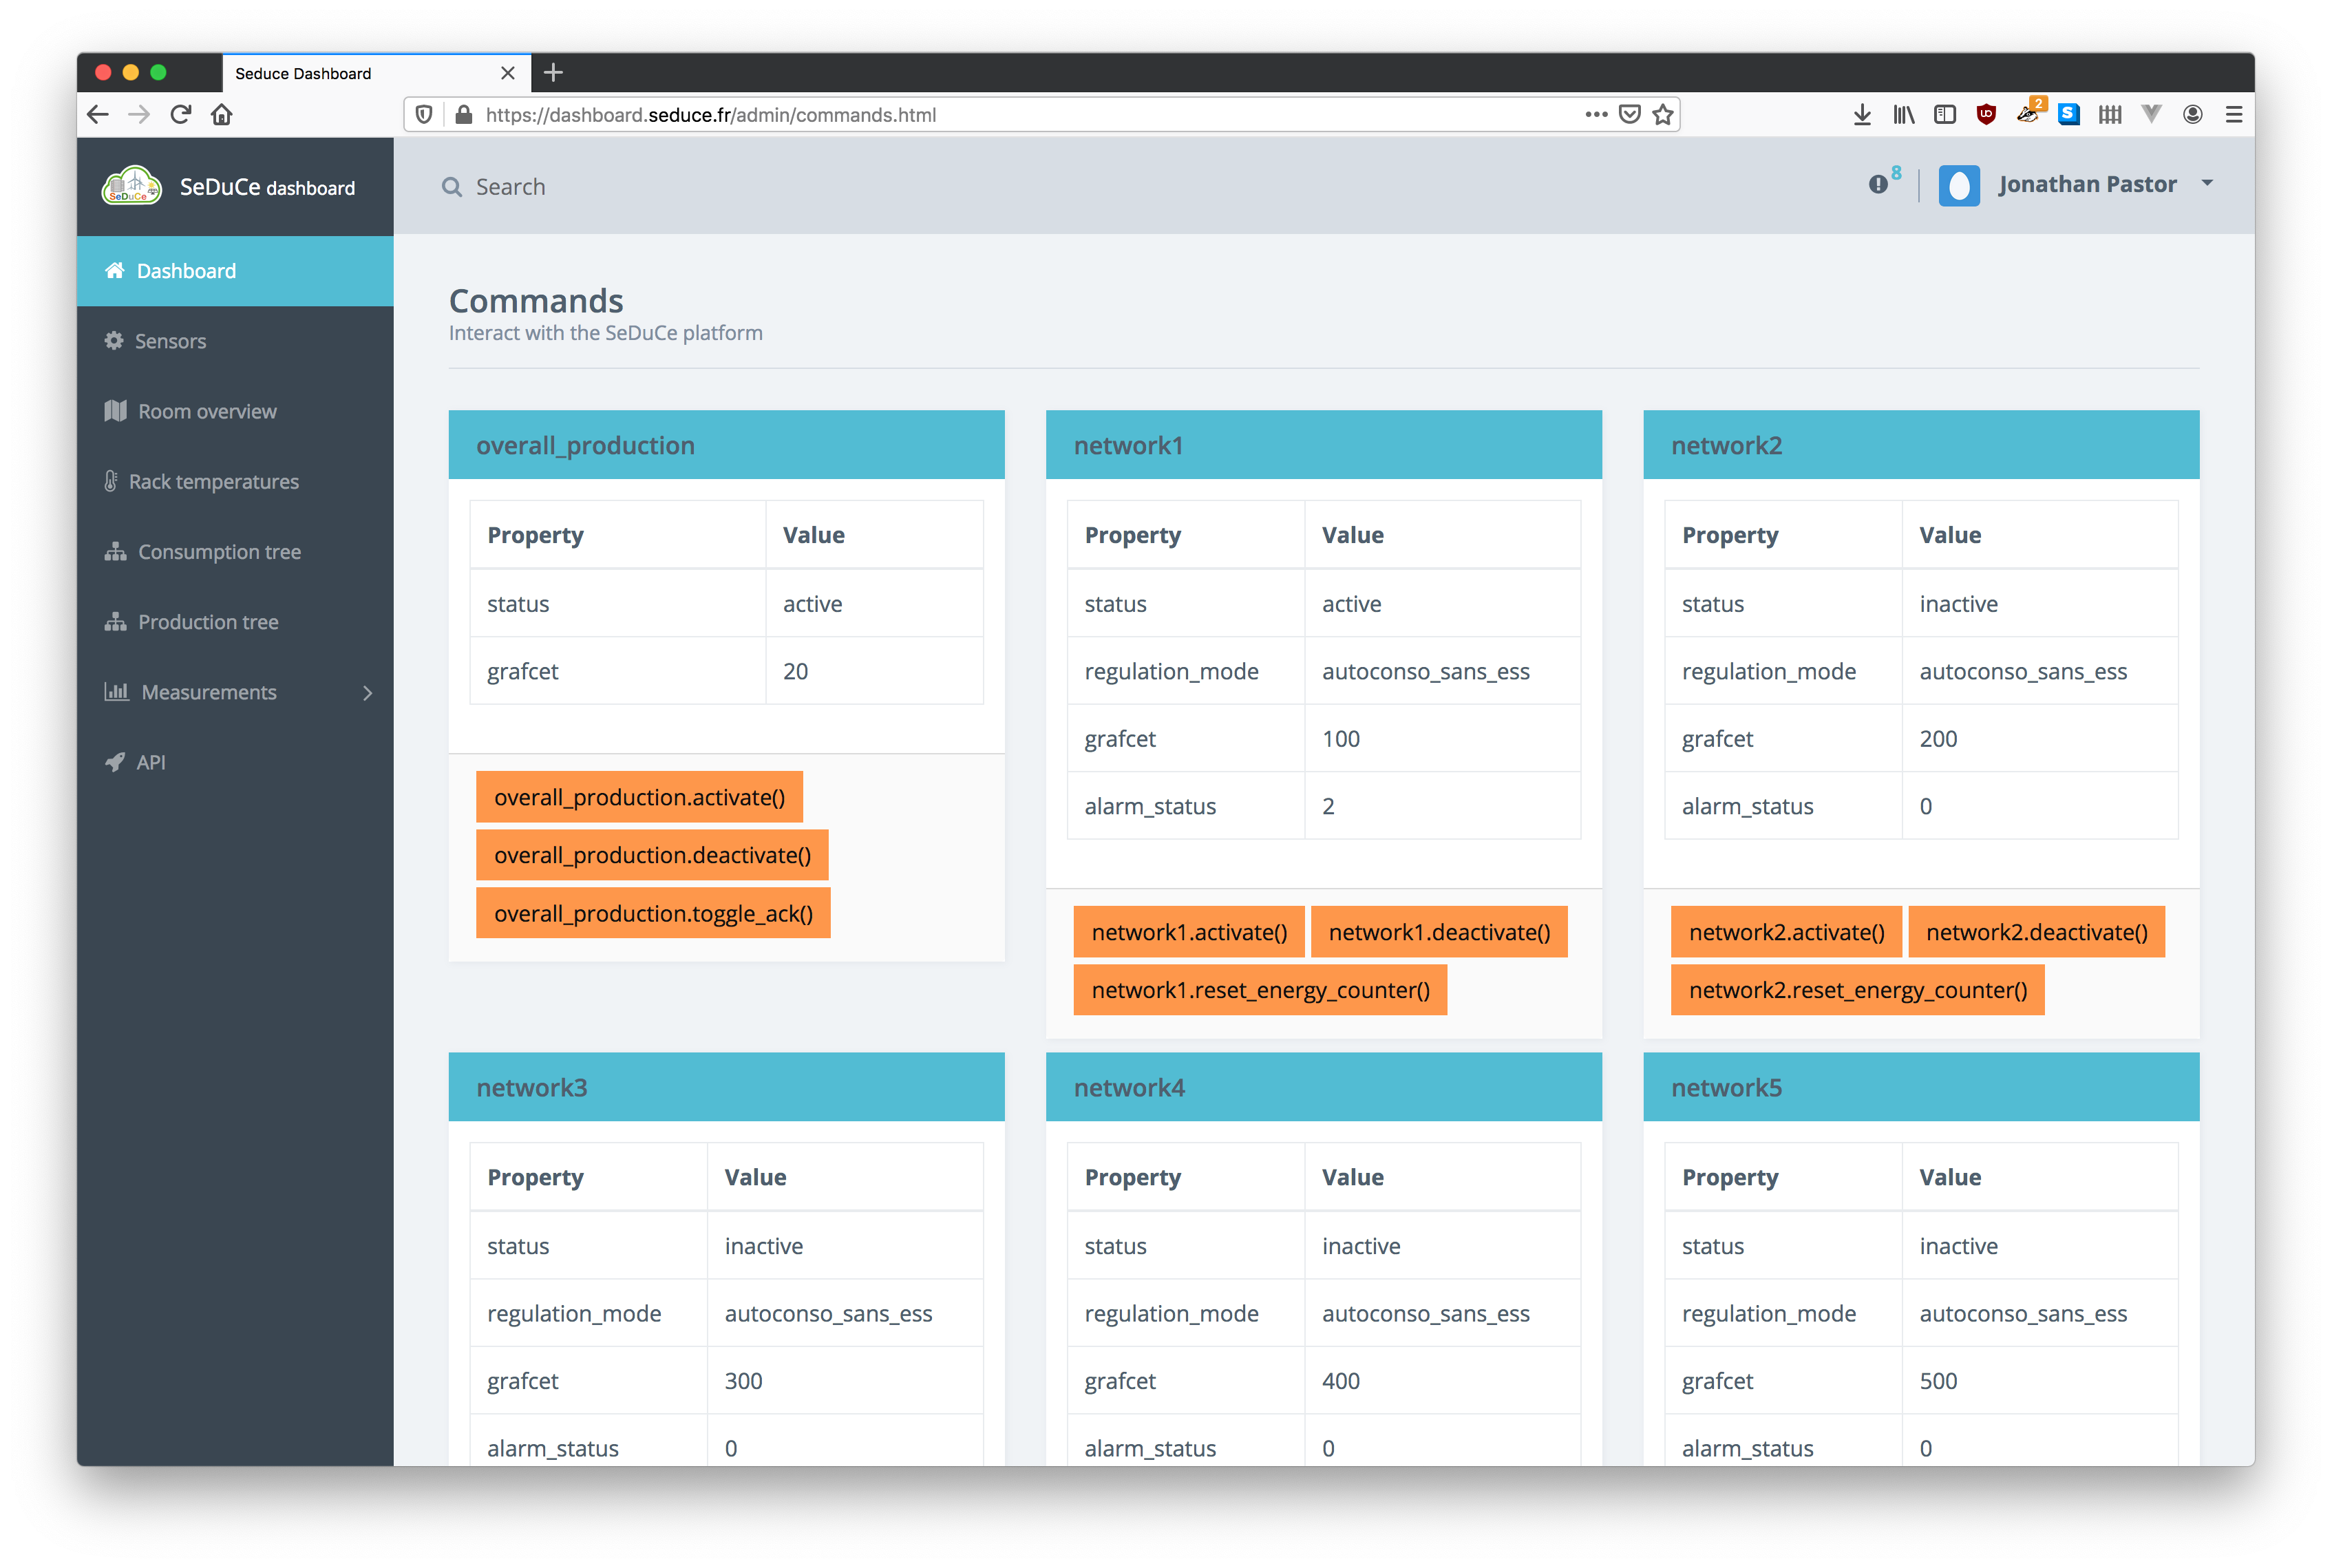
conf/commands.yaml
This file contains the definitions of commands used to manage parts of the SeDuCe testbed, including the electrical network installed by Entech.
This file contains all:
- classes of values (integer 16bits, unsigned integer 16bits, ...) and their endian-ness
- commands
- properties
First we define type of values and their endian-ness:
classes:

  # Entech's sensor bus
  modbus_entech: &modbus_entech
    method: modbus
    ip: 192.168.1.2
    port: 503
    parent: modbus_entech
    location: "outside"

  # Modbus types
  big_endian_int16: &big_endian_int16
    byteorder: '>' # Big endian
    wordorder: '>' # Big endian
    type: int16
    protocol: modbus
and then we define commands as follow:
overall_production:
  actions:
    activate:
      how:
        <<: [*modbus_entech, *little_endian_bool]
        action: write
        register: 3000
        value: 1
    deactivate:
      how:
        <<: [*modbus_entech, *little_endian_bool]
        action: write
        register: 3000
        value: 0
    toggle_ack:
      how:
        <<: [*modbus_entech, *little_endian_bool]
        action: write
        register: 3001
        value: 1
  properties:
    status:
      how:
        <<: [*modbus_entech, *big_endian_bool]
        action: read
        register: 3000
        values:
          active:
            expected_value: 1
          inactive:
            expected_value: 0
    grafcet:
      how:
        <<: [*modbus_entech, *big_endian_int16]
        action: read
        register: 1000
In the previous snippet, we define commands and properties related to the management of the overall production of solar panels.
We define 3 actions activate, deactivate and toggle_ack. Each action defines a property how which explains
how the action should be accomplished. For example, the action activate is done by writting
a little endian boolean value 1 to the 3000 register of the modbus card provided by Entech.
We can also define properties : in the previous example we define two properties status and graphcet.
For example, the action status is done by reading a big endian boolean value in the 3000 register of the modbus card provided by Entech.
If the read value is equals to 1, then the displayed status will be active, and if the read value
is equal to 0, the displayed value will be inactive.
This configuration file is used to generate this page: